National overview · published source listings

National overview of U.S. data center listings

Explore U.S. source listings. Several listings can describe the same facility; a permit or registry record does not establish operation.

Open this selection on the detailed map

Select a point or regional close-up for facts and sources. State outlines open state pages.

Source layers 5 selected
Source layers

Choose which sources to include. Registry layers provide government records, not proof of operating facilities.

Status groups 6 selected
Status groups

Filter by status group. Groups share symbols; each record retains its original status. Approved and permitted, or planned and proposed, remain different source labels.

Published details All listings

Find stated facts, not available capacity. Power types and scope remain separate; a missing fact does not mean a facility lacks it.

Measurement filters keep the same units, scope and timing. Provider capacity is separate.

Browse matching listings ↓

3,361 source listings · 2,325 mapped · 1,036 without a usable coordinate of their own.

All five source layers and every status group. Selections carry across to the detailed map.

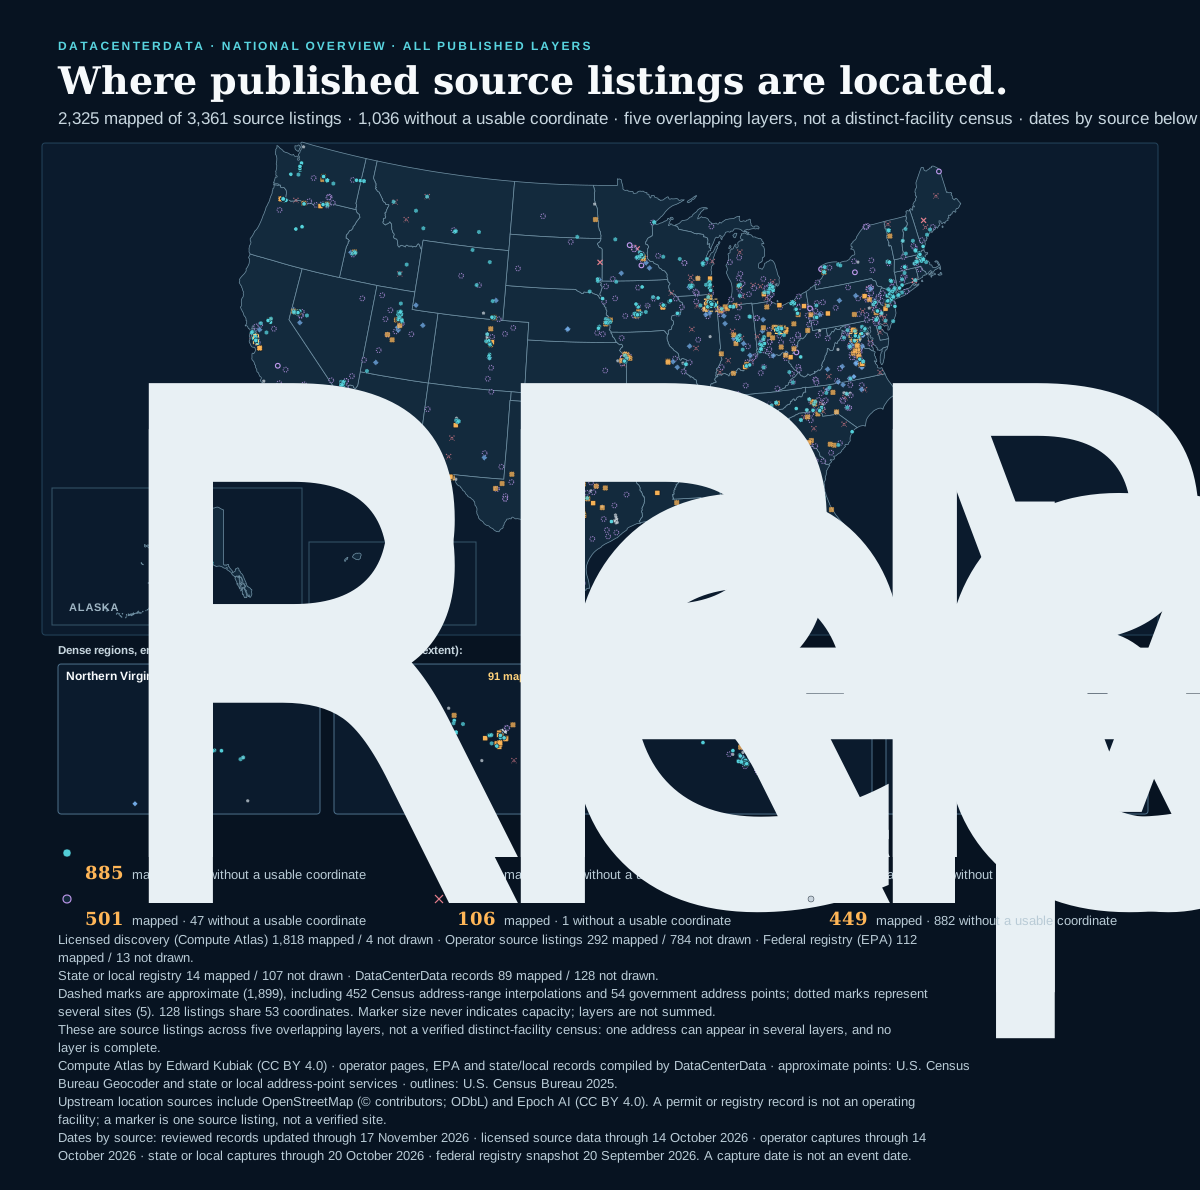
U.S. data center listings across DataCenterData's published layers 2,325 of 3,361 published source listings across five layers have a supported or approximate coordinate and are drawn; 1,036 stay unlocated and are counted, not drawn. Symbols follow source-reported status families: reported operational 885, reported under construction or expanding 257, reported permitted or approved 127, reported proposed, planned or pre-leasing 501, reported cancelled or expired 106, mixed, unstated, unknown or registry status 449. 421 points carry a provider label exact; 1,899 are approximate, including 452 Census address-range interpolations of a published street; 5 represent several sites. 128 listings share 53 coordinates. Layers overlap and are never summed into a facility count. Marker size does not represent capacity. Dates by source: reviewed records updated through 17 November 2026 · licensed source data through 14 October 2026 · operator captures through 14 October 2026 · state or local captures through 20 October 2026 · federal registry snapshot 20 September 2026. A capture date is not an event date. DATACENTERDATA · NATIONAL OVERVIEW · ALL PUBLISHED LAYERS Where published source listings are located. 2,325 mapped of 3,361 source listings · 1,036 without a usable coordinate · five overlapping layers, not a distinct-facility census · dates by source below Alabama: 24 mapped, 9 without a usable coordinateArkansas: 12 mapped, 3 without a usable coordinateArizona: 65 mapped, 27 without a usable coordinateCalifornia: 155 mapped, 88 without a usable coordinateCalifornia: 155 mapped, 88 without a usable coordinateCalifornia: 155 mapped, 88 without a usable coordinateCalifornia: 155 mapped, 88 without a usable coordinateCalifornia: 155 mapped, 88 without a usable coordinateCalifornia: 155 mapped, 88 without a usable coordinateColorado: 45 mapped, 18 without a usable coordinateConnecticut: 10 mapped, 7 without a usable coordinateDelaware: 14 mapped, 2 without a usable coordinateFlorida: 61 mapped, 30 without a usable coordinateFlorida: 61 mapped, 30 without a usable coordinateFlorida: 61 mapped, 30 without a usable coordinateFlorida: 61 mapped, 30 without a usable coordinateGeorgia: 97 mapped, 45 without a usable coordinateIowa: 59 mapped, 19 without a usable coordinateIdaho: 13 mapped, 3 without a usable coordinateIllinois: 87 mapped, 85 without a usable coordinateIndiana: 68 mapped, 25 without a usable coordinateKansas: 18 mapped, 5 without a usable coordinateKentucky: 29 mapped, 6 without a usable coordinateLouisiana: 17 mapped, 7 without a usable coordinateMassachusetts: 31 mapped, 13 without a usable coordinateMassachusetts: 31 mapped, 13 without a usable coordinateMassachusetts: 31 mapped, 13 without a usable coordinateMaryland: 28 mapped, 11 without a usable coordinateMaine: 8 mapped, 3 without a usable coordinateMaine: 8 mapped, 3 without a usable coordinateMichigan: 54 mapped, 23 without a usable coordinateMichigan: 54 mapped, 23 without a usable coordinateMichigan: 54 mapped, 23 without a usable coordinateMichigan: 54 mapped, 23 without a usable coordinateMichigan: 54 mapped, 23 without a usable coordinateMichigan: 54 mapped, 23 without a usable coordinateMinnesota: 44 mapped, 65 without a usable coordinateMissouri: 30 mapped, 12 without a usable coordinateMississippi: 15 mapped, 5 without a usable coordinateMontana: 13 mapped, 5 without a usable coordinateNorth Carolina: 61 mapped, 17 without a usable coordinateNorth Dakota: 4 mapped, 9 without a usable coordinateNebraska: 22 mapped, 14 without a usable coordinateNew Hampshire: 14 mapped, 7 without a usable coordinateNew Jersey: 52 mapped, 31 without a usable coordinateNew Mexico: 17 mapped, 5 without a usable coordinateNevada: 53 mapped, 14 without a usable coordinateNew York: 57 mapped, 29 without a usable coordinateNew York: 57 mapped, 29 without a usable coordinateOhio: 171 mapped, 62 without a usable coordinateOhio: 171 mapped, 62 without a usable coordinateOklahoma: 54 mapped, 12 without a usable coordinateOregon: 51 mapped, 29 without a usable coordinatePennsylvania: 78 mapped, 21 without a usable coordinateRhode Island: 1 mapped, 1 without a usable coordinateRhode Island: 1 mapped, 1 without a usable coordinateSouth Carolina: 18 mapped, 9 without a usable coordinateSouth Dakota: 8 mapped, 7 without a usable coordinateTennessee: 47 mapped, 17 without a usable coordinateTexas: 197 mapped, 70 without a usable coordinateUtah: 54 mapped, 21 without a usable coordinateVirginia: 222 mapped, 79 without a usable coordinateVirginia: 222 mapped, 79 without a usable coordinateVermont: 8 mapped, 0 without a usable coordinateWashington: 48 mapped, 30 without a usable coordinateWashington: 48 mapped, 30 without a usable coordinateWisconsin: 37 mapped, 12 without a usable coordinateWisconsin: 37 mapped, 12 without a usable coordinateWisconsin: 37 mapped, 12 without a usable coordinateWest Virginia: 16 mapped, 4 without a usable coordinateWyoming: 19 mapped, 8 without a usable coordinateAlaska: 7 mapped, 5 without a usable coordinateAlaska: 7 mapped, 5 without a usable coordinateAlaska: 7 mapped, 5 without a usable coordinateAlaska: 7 mapped, 5 without a usable coordinateAlaska: 7 mapped, 5 without a usable coordinateAlaska: 7 mapped, 5 without a usable coordinateAlaska: 7 mapped, 5 without a usable coordinateAlaska: 7 mapped, 5 without a usable coordinateAlaska: 7 mapped, 5 without a usable coordinateAlaska: 7 mapped, 5 without a usable coordinateAlaska: 7 mapped, 5 without a usable coordinateAlaska: 7 mapped, 5 without a usable coordinateAlaska: 7 mapped, 5 without a usable coordinateAlaska: 7 mapped, 5 without a usable coordinateAlaska: 7 mapped, 5 without a usable coordinateAlaska: 7 mapped, 5 without a usable coordinateAlaska: 7 mapped, 5 without a usable coordinateAlaska: 7 mapped, 5 without a usable coordinateAlaska: 7 mapped, 5 without a usable coordinateAlaska: 7 mapped, 5 without a usable coordinateAlaska: 7 mapped, 5 without a usable coordinateAlaska: 7 mapped, 5 without a usable coordinateAlaska: 7 mapped, 5 without a usable coordinateAlaska: 7 mapped, 5 without a usable coordinateAlaska: 7 mapped, 5 without a usable coordinateAlaska: 7 mapped, 5 without a usable coordinateAlaska: 7 mapped, 5 without a usable coordinateAlaska: 7 mapped, 5 without a usable coordinateAlaska: 7 mapped, 5 without a usable coordinateAlaska: 7 mapped, 5 without a usable coordinateAlaska: 7 mapped, 5 without a usable coordinateAlaska: 7 mapped, 5 without a usable coordinateAlaska: 7 mapped, 5 without a usable coordinateAlaska: 7 mapped, 5 without a usable coordinateAlaska: 7 mapped, 5 without a usable coordinateAlaska: 7 mapped, 5 without a usable coordinateAlaska: 7 mapped, 5 without a usable coordinateAlaska: 7 mapped, 5 without a usable coordinateAlaska: 7 mapped, 5 without a usable coordinateAlaska: 7 mapped, 5 without a usable coordinateAlaska: 7 mapped, 5 without a usable coordinateAlaska: 7 mapped, 5 without a usable coordinateAlaska: 7 mapped, 5 without a usable coordinateAlaska: 7 mapped, 5 without a usable coordinateAlaska: 7 mapped, 5 without a usable coordinateAlaska: 7 mapped, 5 without a usable coordinateAlaska: 7 mapped, 5 without a usable coordinateHawaii: 10 mapped, 7 without a usable coordinateHawaii: 10 mapped, 7 without a usable coordinateHawaii: 10 mapped, 7 without a usable coordinateHawaii: 10 mapped, 7 without a usable coordinateHawaii: 10 mapped, 7 without a usable coordinateHawaii: 10 mapped, 7 without a usable coordinateHawaii: 10 mapped, 7 without a usable coordinateHawaii: 10 mapped, 7 without a usable coordinate ALASKA HAWAII Dense regions, enlarged (dashed boxes on the main map show each extent): Northern Virginia131 mapped listingsColumbus91 mapped listingsSilicon Valley85 mapped listingsChicago68 mapped listings Reported operational885mapped · 39 without a usable coordinateReported under construction or expanding257mapped · 47 without a usable coordinateReported permitted or approved127mapped · 20 without a usable coordinateReported proposed, planned or pre-leasing501mapped · 47 without a usable coordinateReported cancelled or expired106mapped · 1 without a usable coordinateMixed, unstated, unknown or registry status449mapped · 882 without a usable coordinate Licensed discovery (Compute Atlas) 1,818 mapped / 4 not drawn · Operator source listings 292 mapped / 784 not drawn · Federal registry (EPA) 112 mapped / 13 not drawn. State or local registry 14 mapped / 107 not drawn · DataCenterData records 89 mapped / 128 not drawn. Dashed marks are approximate (1,899), including 452 Census address-range interpolations and 54 government address points; dotted marks represent several sites (5). 128 listings share 53 coordinates. Marker size never indicates capacity; layers are not summed. These are source listings across five overlapping layers, not a verified distinct-facility census: one address can appear in several layers, and no layer is complete. Compute Atlas by Edward Kubiak (CC BY 4.0) · operator pages, EPA and state/local records compiled by DataCenterData · approximate points: U.S. Census Bureau Geocoder and state or local address-point services · outlines: U.S. Census Bureau 2025. Upstream location sources include OpenStreetMap (© contributors; ODbL) and Epoch AI (CC BY 4.0). A permit or registry record is not an operating facility; a marker is one source listing, not a verified site. Dates by source: reviewed records updated through 17 November 2026 · licensed source data through 14 October 2026 · operator captures through 14 October 2026 · state or local captures through 20 October 2026 · federal registry snapshot 20 September 2026. A capture date is not an event date.
Reported operational 885 mapped · 39 not drawnReported under construction or expanding 257 mapped · 47 not drawnReported permitted or approved 127 mapped · 20 not drawnReported proposed, planned or pre-leasing 501 mapped · 47 not drawnReported cancelled or expired 106 mapped · 1 not drawnMixed, unstated, unknown or registry status 449 mapped · 882 not drawnExact (provider label) 421Approximate, including 452 Census address interpolations1,899Representative of several sites 5
2,325 mapped listings by status family are drawn, every layer at once; 1,036 without a usable coordinate are counted, never placed at a city center. These are source listings across five overlapping layers, not a verified distinct-facility census. Symbols can overlap: 128 listings share 53 coordinates. A tap that cannot separate those markers opens a chooser naming each published record and source layer. A marker is one source listing, not a verified facility; a permit or registry record is not an operating data center. Marker size never indicates capacity. Geographic proximity does not establish an infrastructure connection.

Open this selection on the detailed map in: Alaska Hawaii D.C.

Reference and downloads

Open the background you need. The reference material below does not follow your filters.

All published data — totals before filters and full-map downloads
3,361 source listings across five layers · 3,115 in the data-center layers · 246 government registry records 2,325 mapped · 421 exact (provider label) · 1,899 approximate · 5 representative of several sites 1,036 without a usable coordinate of their own, including 447 linked to another published record's marker 21 published same-site groups · a shared street alone does not establish the same facility

These two full-map files ignore filters. The current-selection download above matches the filtered figure, counts and legend. The overview opens with all five source layers; a direct visit to the detailed map starts with the three data-center layers. Links between the maps keep your filters, except the detailed map’s current-view-only limit. Dates by source: reviewed records updated through 17 November 2026 · licensed source data through 14 October 2026 · operator captures through 14 October 2026 · state or local captures through 20 October 2026 · federal registry snapshot 20 September 2026 (capture dates are not event dates).

Figure notes, dates and attribution

Licensed discovery (Compute Atlas) 1,818 mapped / 4 not drawn · Operator source listings 292 mapped / 784 not drawn · Federal registry (EPA) 112 mapped / 13 not drawn.

State or local registry 14 mapped / 107 not drawn · DataCenterData records 89 mapped / 128 not drawn.

Dashed marks are approximate (1,899), including 452 Census address-range interpolations and 54 government address points; dotted marks represent several sites (5). 128 listings share 53 coordinates. Marker size never indicates capacity; layers are not summed.

These are source listings across five overlapping layers, not a verified distinct-facility census: one address can appear in several layers, and no layer is complete.

Compute Atlas by Edward Kubiak (CC BY 4.0) · operator pages, EPA and state/local records compiled by DataCenterData · approximate points: U.S. Census Bureau Geocoder and state or local address-point services · outlines: U.S. Census Bureau 2025.

Upstream location sources include OpenStreetMap (© contributors; ODbL) and Epoch AI (CC BY 4.0). A permit or registry record is not an operating facility; a marker is one source listing, not a verified site.

Dates by source: reviewed records updated through 17 November 2026 · licensed source data through 14 October 2026 · operator captures through 14 October 2026 · state or local captures through 20 October 2026 · federal registry snapshot 20 September 2026. A capture date is not an event date.

Source layers, status labels and precision

Full dataset · before filters

Layers, status labels and precision.

These tables always count all five published source layers. They do not change with the selection above. Each layer keeps its own source, date and attribution.

By layer

Operator source listings include standalone entries and listings attached to licensed records. DataCenterData records include project, facility and water case-study records; each record states its evidence status.

LayerInteractive map Layers menuSource listingsMappedOf which approximate (Census)Without a usable coordinateOf which shown through a published recordDate (kind)Source and attribution
Licensed discovery (Compute Atlas)Data centers · on by default1,8221,81804014 October 2026 (licensed source date)Compute Atlas by Edward Kubiak, edition 1.34.1, CC BY 4.0; provider coordinates and labels
Operator-listedData centers · on by default1,07629227178442714 October 2026 (latest capture date)Operators’ own pages, compiled by DataCenterData with citation; no operator coordinate is published, so points are Census address interpolations or government address points
Federal registry (EPA)Government records · context, off by default1251129713020 September 2026 (EPA snapshot date)U.S. EPA registry records (public domain); points are Census address interpolations or government address points
State or local registryGovernment records · context, off by default12114141072020 October 2026 (latest capture date)State and local government records, cited; points are Census address interpolations or government address points
Independently reviewedData centers · on by default2178970128017 November 2026 (last reviewed change)DataCenterData reviewed records; a point only where the record cites one or its street was reviewed

Layers on the detailed map are independent checkboxes: the three data-center layers (licensed directory rows, operator source listings, DataCenterData records) are on when the map opens; the two government registry layers are context a reader switches on, because a certification, permit, application or EPA registration is not an operating data center. The dates are of different kinds: a licensed source date, a capture date for operator and state or local records, an EPA snapshot date and the last reviewed change; a capture date is not an event date and does not show that every older record is current. No transmission, power-plant or substation layer is offered; proximity would not prove a connection.

Approximate points for operator-listed, federal, state or local and reviewed listings are U.S. Census Bureau geocoder address-range interpolations of the published street or, where that gave no usable answer, state or local government address points (54 of them), reviewed by DataCenterData for house number, street name, state, city or postal code and the state outline. They are not rooftop, parcel or building coordinates. Listings attached to a licensed row (an operator’s own listing or a government record shown on that row’s page) are shown through that row’s marker rather than given a second one.

By source-reported status

This table groups original source labels into status groups across all five layers, separating mapped listings from listings without their own coordinate. The figure above follows your filters. Detailed-map summaries retain each original label separately, including “operational” and “operating”. The navigation links carry the current selection and add the chosen status; they may therefore show fewer listings than this full-dataset table. A direct visit to the detailed map starts with the three data-center layers. Neither presentation counts distinct facilities.

Family on the overviewSource-reported labelMappedWithout a usable coordinateFilter the interactive map (all five layers on)
Reported operationalSource-reported operational84810Show operational
Source-reported operating3729Show operating
Reported under construction or expandingSource-reported under construction24719Show under construction
Source-reported construction924Show construction
Source-reported expanding14Show expanding
Reported permitted or approvedSource-reported permitted1260Show permitted
Source-reported approved120Show approved
Reported proposed, planned or pre-leasingSource-reported proposed49829Show proposed
Source-reported planned118Show planned
Source-reported pre-leasing20Show preleasing
Reported cancelled or expiredSource-reported cancelled1060Show cancelled
Source-reported expired01Show expired
Mixed, unstated, unknown or registry statusLifecycle varies or is partly unstated by listing20Show mixed
Lifecycle not stated301847Show not stated
Status unknown3422Show unknown
EPA registry record11213Show registry record

Status groups share symbols and can be switched on or off above. “Permitted” and “approved” remain different acts; “planned” and “proposed” remain different stages. Unknown includes status not stated and registry records; it does not mean operating.
All 50 states — listings and map coverage

Full dataset · by state

Into state and local records.

These totals count all five published layers before filters. State pages hold records and gaps still open. Each detailed-map link keeps your current selection and adds that state.

StateSource listingsMappedOf which approximateWithout a usable coordinateExplore
Alabama3324209Interactive map · Directory
Alaska12775Interactive map · Directory
Arizona92655227Interactive map · Directory
Arkansas1512113Interactive map · Directory
California24315511988Interactive map · Directory
Colorado63453818Interactive map · Directory
Connecticut171077Interactive map · Directory
Delaware1614142Interactive map · Directory
Florida91615430Interactive map · Directory
Georgia142978745Interactive map · Directory
Hawaii171097Interactive map · Directory
Idaho1613133Interactive map · Directory
Illinois172876985Interactive map · Directory
Indiana93686725Interactive map · Directory
Iowa78594419Interactive map · Directory
Kansas2318165Interactive map · Directory
Kentucky3529266Interactive map · Directory
Louisiana2417147Interactive map · Directory
Maine11863Interactive map · Directory
Maryland39282011Interactive map · Directory
Massachusetts44312813Interactive map · Directory
Michigan77545123Interactive map · Directory
Minnesota109443365Interactive map · Directory
Mississippi2015155Interactive map · Directory
Missouri42302912Interactive map · Directory
Montana1813135Interactive map · Directory
Nebraska36222114Interactive map · Directory
Nevada67533914Interactive map · Directory
New Hampshire2114137Interactive map · Directory
New Jersey83523631Interactive map · Directory
New Mexico2217155Interactive map · Directory
New York86574829Interactive map · Directory
North Carolina78615617Interactive map · Directory
North Dakota13449Interactive map · Directory
Ohio23317113162Interactive map · Directory
Oklahoma66545312Interactive map · Directory
Oregon80512129Interactive map · Directory
Pennsylvania99786821Interactive map · Directory
Rhode Island2111Interactive map · Directory
South Carolina2718179Interactive map · Directory
South Dakota15867Interactive map · Directory
Tennessee64473817Interactive map · Directory
Texas26719716970Interactive map · Directory
Utah75544321Interactive map · Directory
Vermont8880Interactive map · Directory
Virginia30122216579Interactive map · Directory
Washington78482530Interactive map · Directory
West Virginia2016134Interactive map · Directory
Wisconsin49373312Interactive map · Directory
Wyoming2719178Interactive map · Directory
District of Columbia2220Interactive map

Fifty-state presence is not completeness. A state with few listings has few published source rows, not necessarily few data centers.

Licensed discovery reference map — Compute Atlas

Figure 2 · licensed discovery only

The Compute Atlas view, kept separate.

This figure draws only the licensed discovery layer (Compute Atlas rows with provider coordinates and lifecycle labels). This static reference does not change with the filters above. It is the reusable CC BY 4.0 rendering; it covers 1,818 of 1,822 licensed source rows and excludes every other layer.

848reported operational
371construction or permitted
493reported proposed
421exact (provider label)
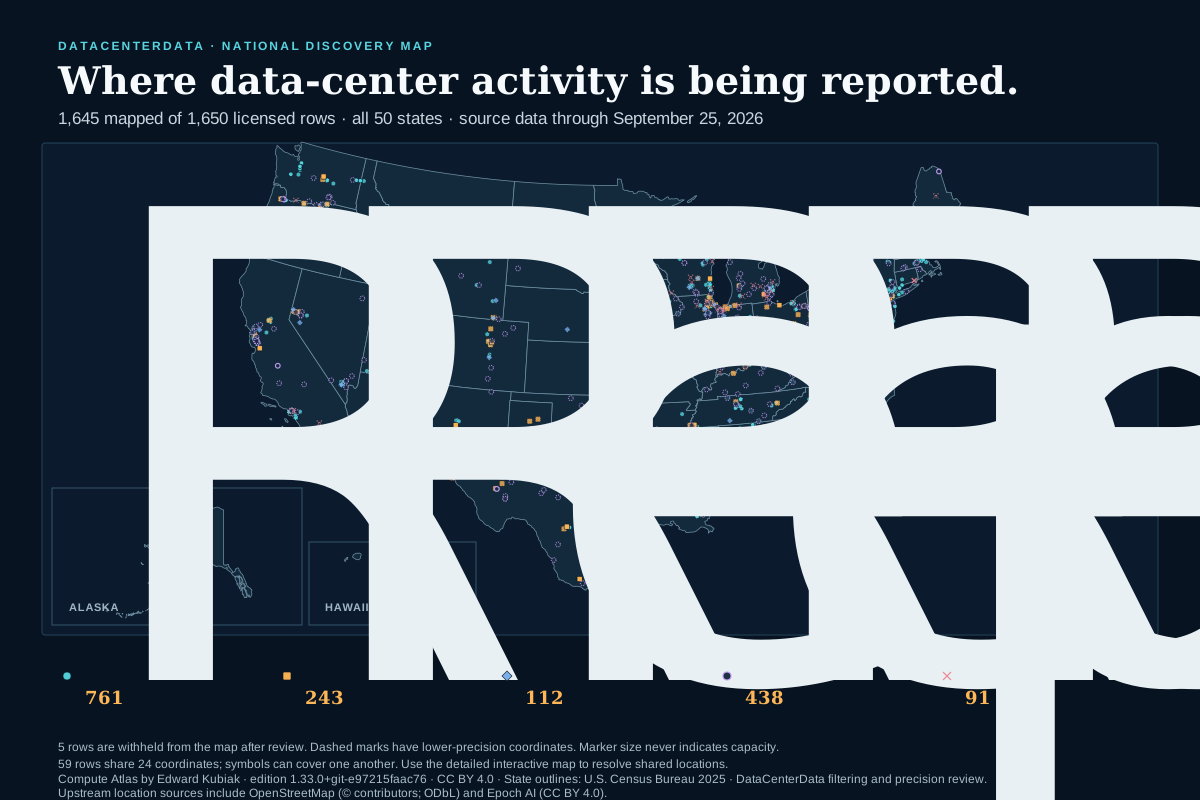
U.S. data center activity reported by licensed sources 1,818 of 1,822 licensed source rows are mapped across all 50 states: 848 reported operational, 245 under construction, 126 permitted, 493 proposed, and 106 cancelled. 4 rows are excluded after DataCenterData review because they are not a data center, duplicate another row, or lack a usable location. 421 source points retain the provider label exact and 1,397 are displayed as approximate or representative after DataCenterData's precision review. 70 mapped rows share 29 coordinates, so symbols can cover one another. Marker size does not represent capacity. DATACENTERDATA · NATIONAL DISCOVERY MAP Where data-center activity is being reported. 1,818 mapped of 1,822 licensed rows · all 50 states · source data through 14 October 2026 ALASKA HAWAII Reported operational848Reported under construction245Reported permitted126Reported proposed493Reported cancelled106 4 rows are withheld from the map after review. Dashed marks have lower-precision coordinates. Marker size never indicates capacity. 70 rows share 29 coordinates; symbols can cover one another. Use the detailed interactive map to resolve shared locations. Compute Atlas by Edward Kubiak · edition 1.34.1 · CC BY 4.0 · State outlines: U.S. Census Bureau 2025 · DataCenterData filtering and precision review. Upstream location sources include OpenStreetMap (© contributors; ODbL) and Epoch AI (CC BY 4.0).
Reported operational 848 Reported under construction 245 Reported permitted 126 Reported proposed 493 Reported cancelled 106 Exact (provider label) 421 Approximate or representative 1,397
1,818 licensed source rows are plotted (1,818 of 1,822 licensed source rows); 4 remain searchable but are withheld from this map after review. Symbols can overlap: 70 rows share 29 coordinates, so use the detailed map to resolve shared locations. Dashed marks use approximate or representative coordinates. Geographic proximity does not establish an infrastructure connection.

What this makes visible

Concentration without false precision.

Dense areas show where the published layers contain many listings. Equal-size symbols prevent a source-reported capacity field from dominating the national picture, and both figures keep operational, construction, permitted, proposed, cancelled and not-stated labels separate.

What it does not claim

No census. No connection inference.

The figures do not establish which facility is open, how much power it uses, whether nearby infrastructure serves it, or whether an unmarked place has no data center. Operator, government and reviewed layers are drawn beside the licensed layer in Figure 1 and are not merged into it; the same street across layers stays separate listings. Use the interactive map and linked citations to inspect individual rows.

Source, geometry and reuse

Licensed facility locations and source-reported lifecycle labels are adapted from Compute Atlas by Edward Kubiak, edition 1.34.1, under CC BY 4.0. DataCenterData filters the source to data-center rows in the 50 states, assigns durable directory IDs and creates these renderings. As disclosed changes, DataCenterData displays 223 provider-labeled “exact” points as approximate when evidence does not support an exact point, and withholds 4 rows from the map after review; the original provider rows and labels remain visible in the searchable directory. Operator-listed points are compiled by DataCenterData from operators’ own pages with citation (reference only; no page text is republished and no license is granted for the compilation). Federal registry points are U.S. EPA records (public domain for the EPA fields); state or local registry points are cited government records. Approximate points for those layers come from the U.S. Census Bureau Geocoder (address-range interpolation, a U.S. government work) after DataCenterData’s review of each published address; a smaller set are state or local government address points, each naming its publisher, under the same review. Those are cited, not relicensed. State outlines are adapted from the U.S. Census Bureau’s 2025 cartographic boundary file. The licensed-only SVG can be reused under CC BY 4.0 with this attribution and the same limitations; the all-layers SVG may be reproduced for reference with this attribution and carries no license for the DataCenterData compilation.

Some locations in this layer are reported by the provider as derived from OpenStreetMap (© OpenStreetMap contributors, ODbL, https://www.openstreetmap.org/copyright) and Epoch AI (CC BY 4.0).